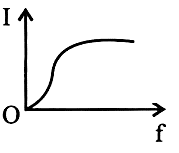
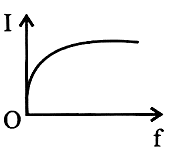
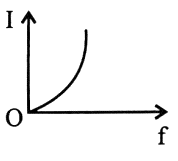
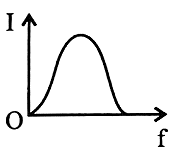
An a.c source of variable frequency f is connected to an LCR series circuit. Which of the graphs in figure represents the variation of current I in the circuit with frequency f ?
A
B
C
D
Text Solution
Verified by ExpertsThe correct answer is:
D
Current through the circuit is given by  ,
,
where, 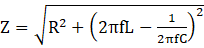
From the above equation at 
As frequency increases Z decreases therefore the current, I increases
When,  (resonant frequency) Z becomes minimum & I becomes maximum
For 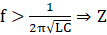 starts increasing and current I goes on decreasing
Prepare Smarter with CGP Edu
Get practice questions, solutions, and test series in one place.
Write a Review
Share your experience with this question and solution.
Commentary
Send your comment, doubt, correction, or feedback to admin.
Similar Questions
Explore conceptually related problems
Calculate the value of capacity in picofarad, which will make 101.4 microhenry inductance to oscill…
A 100 mH inductor, a capacitor and resistor are connected in series to a a.c source. Calculate t…
An alternating current of 1.5 mA and angular frequency flows through a resistor and a capacitor …
A bulb of resistance , connected to an inductor of inductance L is in series with an a.c source ma…
A coil of resistance and inductance 1H is connected across an alternating voltage of frequency . …
L, C, R represents physical quantities inductance capacitance and resistance respectively. The comb…