Published by:
CGP EDU Academic Team
Published on: September 12, 2026
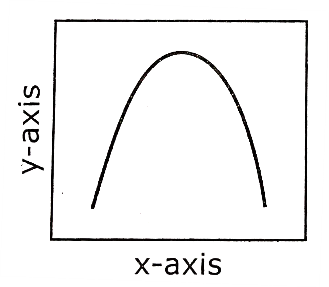
The curve given below shows enzymatic activity with relation to three conditions (pH, temperature and substrate concentration) What do the two axis (  and
and  ) represent?
A
x-axis-Enzymatic activity, y-axis- pH
B
 -axis-Temperature,
  -axis-Enzyme activity
 C
 -axis-Substrate concentration,
  -axisEnzymatic activity
 D
 -axis-Enzymatic activity,
  -axisTemperature
Text Solution
Verified by ExpertsThe correct answer is:
B
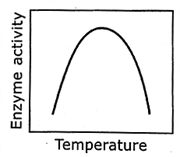
The graph depicting enzymatic activity with a peak typically relates to the effect of pH or temperature on enzyme activity. The curve shows that enzymatic activity increases to an optimum level and then decreases, which aligns with the standard representation where one condition (like pH) is varied.
Prepare Smarter with CGP Edu
Get practice questions, solutions, and test series in one place.
Write a Review
Share your experience with this question and solution.
Commentary
Send your comment, doubt, correction, or feedback to admin.
Similar Questions
Explore conceptually related problems
Physics
A stationary body explodes into two fragments of masses and . If momentum of one fragment…
What charge would be required to electrify a sphere of radius 25 cm , so as to get a surface charge…
denotes a transverse wave propagating through a uniform string of mass per unit length . The aver…
During the head on collision of two masses of 1 kg and 2 kg , the maximum energy of deformation is …
A spherical oil drop of radius has a small charge equivalent to 40 electrons. The energy that woul…
A large number of particles of same mass are kept at horizontal distances of and so on from poin…