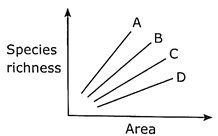
The above graph represent species area relation of different area A, B, C and D which shows greatest species richness-
Text Solution
Verified by ExpertsD
Species diversity is measured by the number of species per unit area.
In the given graph, Line A has the least area but the largest species richness as compared to others.
Line  has less area than
  but more species richness as compared to C .
In line  , the area is less as compared to line
  , but the richness is higher when compared to line D .
The least species richness lies in line D, where the area is large but the number of species is less.
Prepare Smarter with CGP Edu
Get practice questions, solutions, and test series in one place.
Write a Review
Share your experience with this question and solution.
Commentary
Send your comment, doubt, correction, or feedback to admin.
Similar Questions
Explore conceptually related problems