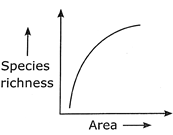
Relationship between species richness (S) and area




Text Solution
Verified by ExpertsB
The graph shown represents the species-area relationship, which describes how species richness (S) increases with increasing area . The curve rises rapidly at first and then levels off, showing that larger areas tend to have more species, but the rate of increase slows down as area increases.
Mathematically, this relationship is commonly expressed as:-
 Here:-
S = species richness
 area
area
 constant (dependent on the taxonomic group and region)
 slope of the curve in a log-log plot, indicating how quickly species richness increases with area.
Prepare Smarter with CGP Edu
Get practice questions, solutions, and test series in one place.
Write a Review
Share your experience with this question and solution.
Commentary
Send your comment, doubt, correction, or feedback to admin.
Similar Questions
Explore conceptually related problems