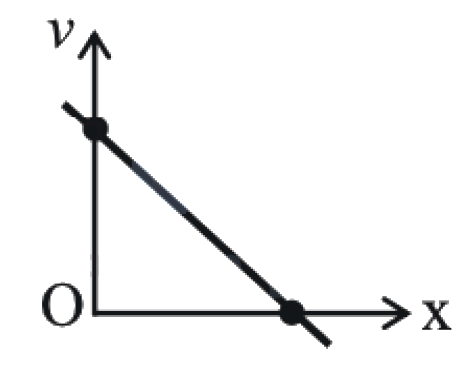
The velocity  - Distance
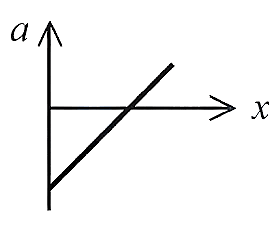
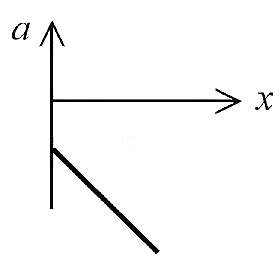
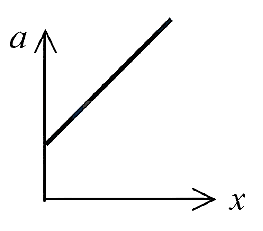
  graph is shown in figure. Which graph represents acceleration
  versus distance
  variation of this system?
Text Solution
Verified by ExpertsA
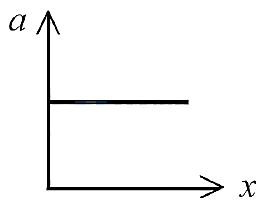
The v-x graph shows velocity decreasing linearly with distance. Using kinematic equation  , we can establish the relationship between acceleration and position.
From the linear v-x relationship, differentiating using  yields acceleration that is linearly proportional to distance from the origin.
The a-x graph shows a straight line passing through the origin with positive slope, indicating that acceleration increases linearly with distance while remaining positive throughout the motion.
Prepare Smarter with CGP Edu
Get practice questions, solutions, and test series in one place.
Write a Review
Share your experience with this question and solution.
Commentary
Send your comment, doubt, correction, or feedback to admin.
Similar Questions
Explore conceptually related problems