Using a simple pendulum experiment  is determind by measuring its time period
  . Which of the following plots represent the correct relation between the pendulum length
  and time period
  ?
?
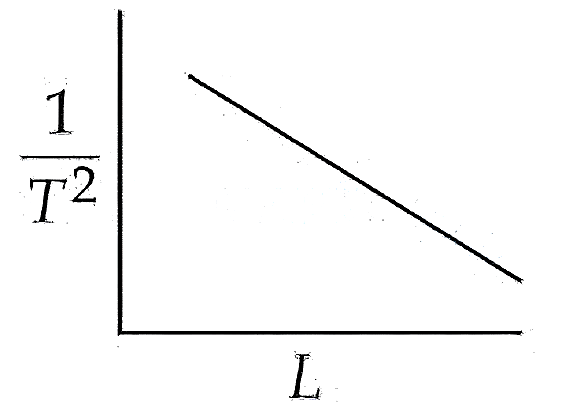
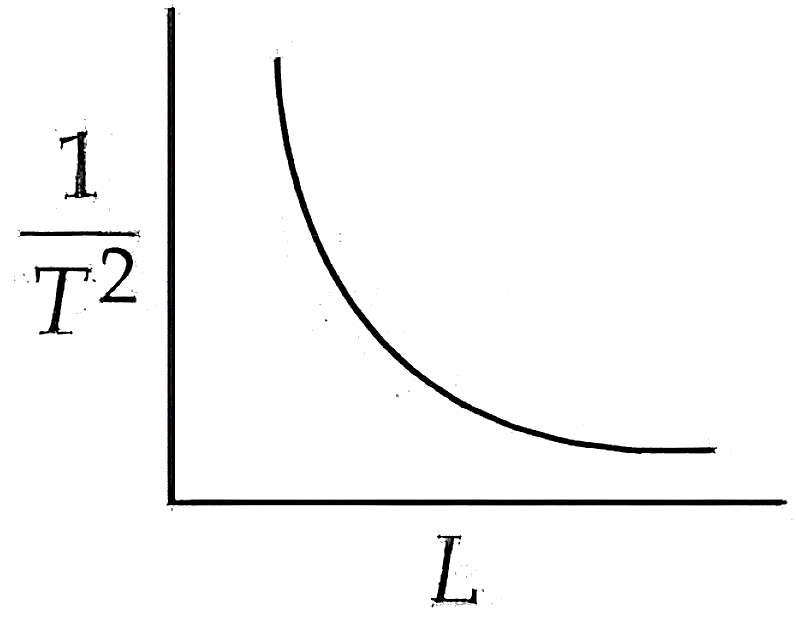
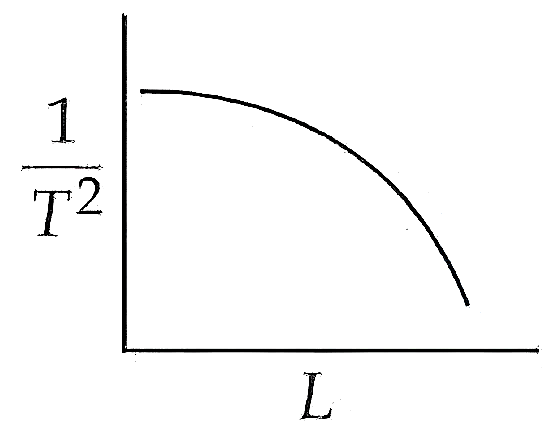
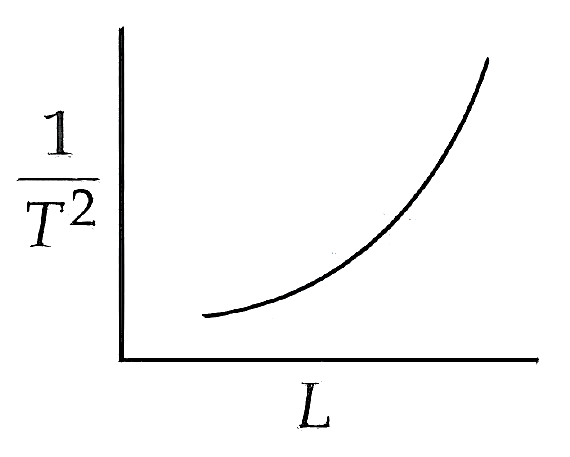
Text Solution
Verified by ExpertsB
The time period  of a simple pendulum of length
  is given by the formula:
 Squaring both sides, we get:
 Rearranging the equation to find the relationship between
  and
and  :
:
 Let
Let  and
and  . The equation becomes:
 where
where  is a constant.
This is the equation of a rectangular hyperbola in the first quadrant.
As  increases,
  decreases non-linearly, approaching the axes asymptotically.
Comparing this with the given plots, option correctly represents a hyperbolic relationship between  and
and  .
.
Prepare Smarter with CGP Edu
Get practice questions, solutions, and test series in one place.
Write a Review
Share your experience with this question and solution.
Commentary
Send your comment, doubt, correction, or feedback to admin.
Similar Questions
Explore conceptually related problems