Published by:
CGP EDU Academic Team
Published on: September 13, 2026
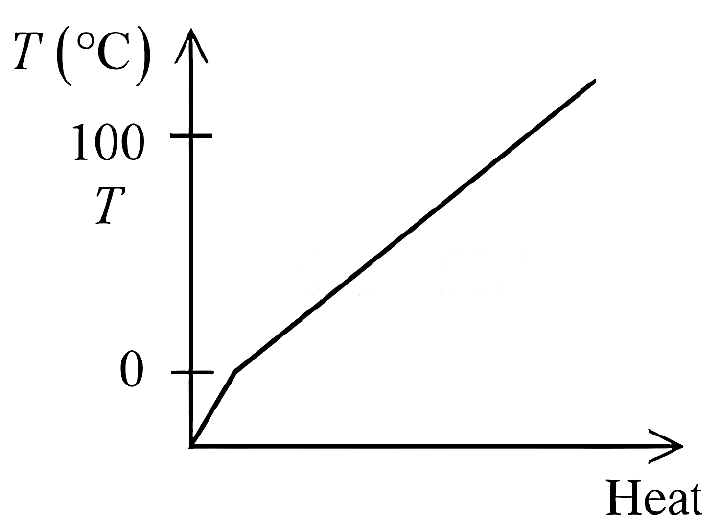
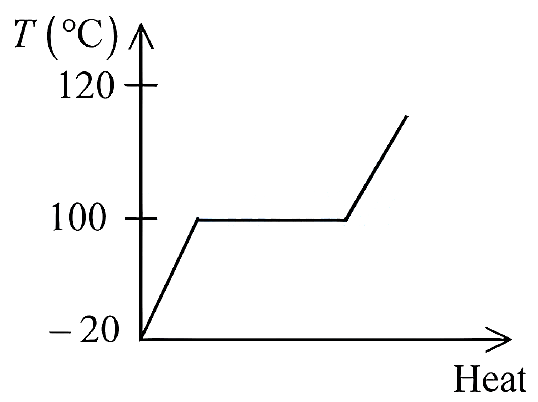
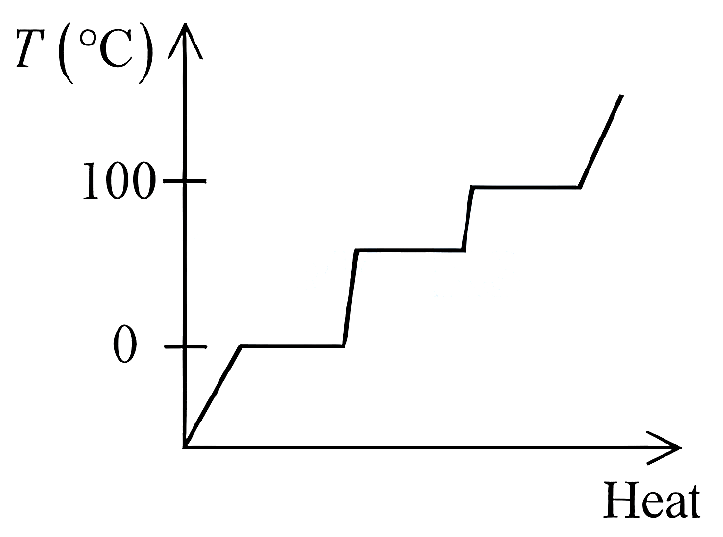
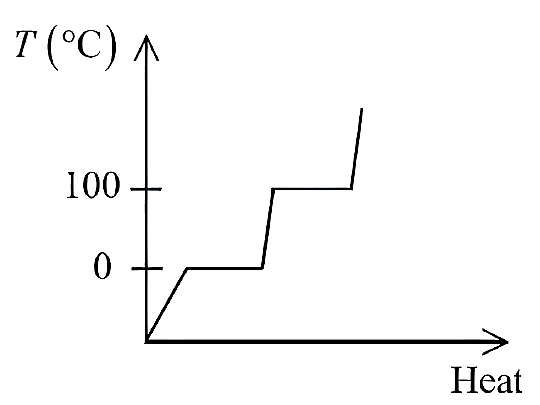
Which of the following best represents the temperature versus heat supplied graph for water, in the range of  to
to  ?
?
A
B
C
D
Text Solution
Verified by ExpertsThe correct answer is:
D
 to
to  at
at  phase change take place.
  to
to  ,
,  at
at  phase change take place.
Prepare Smarter with CGP Edu
Get practice questions, solutions, and test series in one place.
Write a Review
Share your experience with this question and solution.
Commentary
Send your comment, doubt, correction, or feedback to admin.
Similar Questions
Explore conceptually related problems
A metallic sphere cools from to in 300 s. If atmospheric temperature around is , then the sphere…
Three rods of identical cross-section and lengths are made of three different materials of thermal …
A thermally insulated vessel contains an ideal gas of molecular mass M and ratio of specific heats …
For a perfect gas, two pressures P 1 and P 2 are shown in figure. The graph shows:
If K 1 and K 2 are the thermal conductivities L 1 and L 2 are the lengths and ai and A 2 are the cr…
A unit scale is to be prepared whose length does not change with temperature and remains 20 cm, usi…