Which of the following graphs represent the variation of relative permeability µ r magnetic intensity (H) for a ferromagnetic material?
A
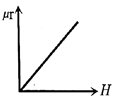
B
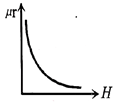
C
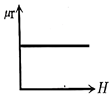
D
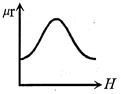
Text Solution
Verified by ExpertsThe correct answer is:
D
 as we know M dependent on H, initially value of
  is smaller, so value of
  increases with H but slowly but with further increases of H, value of
  also increases, i.e.
  increases speedily.
When material fully magnetized, M becomes constant, and then with the increase of  decreases
  decreases.
Prepare Smarter with CGP Edu
Get practice questions, solutions, and test series in one place.
Write a Review
Share your experience with this question and solution.
Commentary
Send your comment, doubt, correction, or feedback to admin.
Similar Questions
Explore conceptually related problems
Unit of magnetic flux density (or magnetic induction) is
A magnet is placed in iron powder and then taken out, then maximum iron powder is at
If a magnet of pole strength m is divided into four parts such that the length and width of each pa…
The distance of two points on the axis of a magnet from its centre is 10 cm and 20 cm respectively.…
The magnetism of magnet is due to
The pole strength of a bar magnet is 48 ampere-meter and the distance between its poles is 25 cm. T…