Published by:
CGP EDU Academic Team
Published on: September 13, 2026
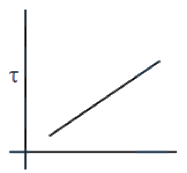
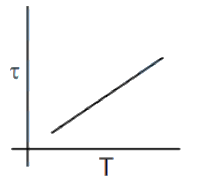
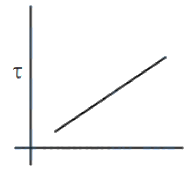
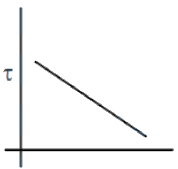
The plot that depicts the behavior of the mean free time  (time between two successive collisions) for the molecules of an ideal gas, as a function of temperature
  , qualitatively, is: (Graphs are schematic and not drawn to scale)
A
B
C
D
Text Solution
Verified by ExpertsThe correct answer is:
A
JEE Main 2020

Prepare Smarter with CGP Edu
Get practice questions, solutions, and test series in one place.
Write a Review
Share your experience with this question and solution.
Commentary
Send your comment, doubt, correction, or feedback to admin.
Similar Questions
Explore conceptually related problems
The ratio of specific heats in terms of degree of freedom (f) is given by:
According to kinetic theory of gases,
A. The motion of the gas molecules freezes at 0°C
B. The mean…
The ratio of specific heats in terms of degree of freedom (f) is given by:
In Vander Waals equation P is pressure, V is volume, R is universal gas constant and T is temperat…
An expression of energy density is given by , where are constants, x is displacement, k is Boltzm…
Following statements are given :
(1) The average kinetic energy of a gas molecule decreases when th…