Published by:
CGP EDU Academic Team
Published on: September 12, 2026
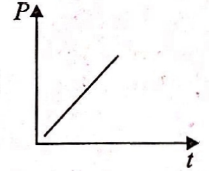
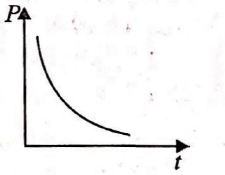
A soap bubble formed at the end of the tube is blown very slowly. The graph between excess of pressure inside the bubble with time is
A
B
C
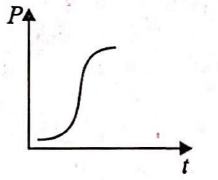
D
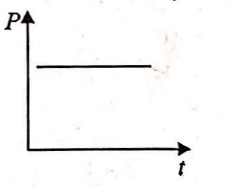
Text Solution
Verified by ExpertsThe correct answer is:
B
As excess pressure inside the soap bubble of radius r, is
 or
or 
Therefore, as r increase with time, P decreases so the variation of P with time t will be a parabolic curve as shown is option.
Prepare Smarter with CGP Edu
Get practice questions, solutions, and test series in one place.
Write a Review
Share your experience with this question and solution.
Commentary
Send your comment, doubt, correction, or feedback to admin.
Similar Questions
Explore conceptually related problems
Two bodies are in equilibrium when suspended in water from the arms of a balance. The mass of one b…
An inverted bell lying at the bottom of a lake 47.6 m deep has 50 cm 3 of air trapped in it. The be…
A uniformly tapering vessel is filled with a liquid of density 900 kg/m 3 . The force that acts on …
A siphon in use is demonstrated in the following figure. The density of the liquid flowing in sipho…
The height of a mercury barometer is 75 cm at sea level and 50 cm at the top of a hill. Ratio of de…
Density of ice is and that of water is . What will be the decrease in volume when a mass M of ice…