Published by:
CGP EDU Academic Team
Published on: September 12, 2026
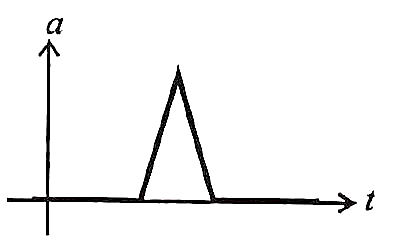
The given acceleration -time graph represents which of the following physical situations?
Text Solution
Verified by ExpertsThe correct answer is:
A
The a-t graph shows that initially the body moves with uniform velocity. Its acceleration increases for a short time and then falls to zero and there after the body moves with a constant velocity. Such a physical Situation arises when a cricket ball moving with a uniform speed is hit with a bat for a very short time interval.
Prepare Smarter with CGP Edu
Get practice questions, solutions, and test series in one place.
Write a Review
Share your experience with this question and solution.
Commentary
Send your comment, doubt, correction, or feedback to admin.
Similar Questions
Explore conceptually related problems
A particle of mass m is dropped from a height h above the ground. At the same time another particle…
The relation between root mean square speed (v rms ) and most probable speed (v p ) for the molar m…
A tuning fork of frequency 340 Hz resonates in the fundamental mode with an air column of length 12…
A force on an object of mass 100g is . The position of that object at t = 2s is after starting fr…
is a vector quantity such that = nonzero constant. Which of the following expressions is true for…
The distance of the Sun from earth is 1.5 x 10 11 m and its angular diameter is (2000) s when obser…