Published by:
CGP EDU Academic Team
Published on: September 13, 2026
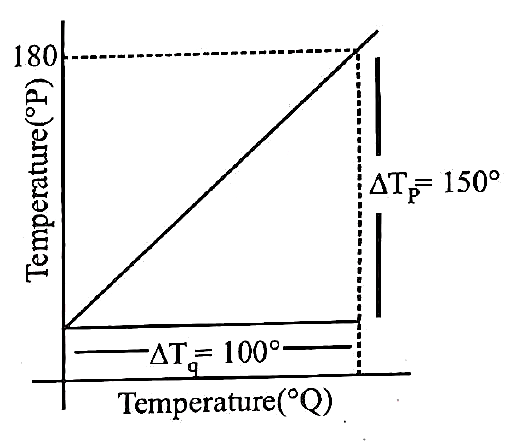
The graph between two temperature scales  and
and  is shown in the figure. Between upper fixed point and lower fixed point there are 150 equal divisions of scale
  and 100 divisions on scale
  . The relationship for conversion between the two scales is given by:
A

B

C

D

Text Solution
Verified by ExpertsThe correct answer is:
B
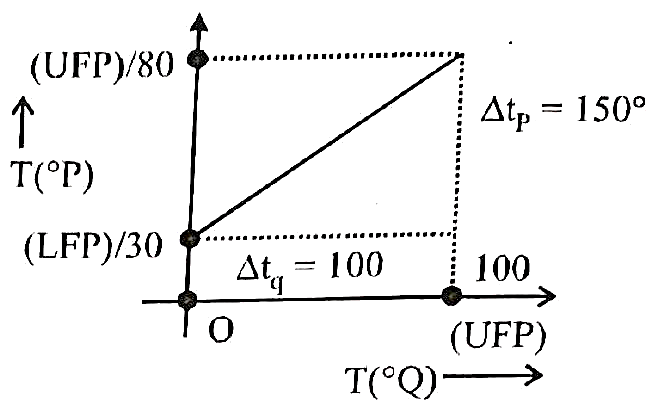
As,  Constant

Prepare Smarter with CGP Edu
Get practice questions, solutions, and test series in one place.
Write a Review
Share your experience with this question and solution.
Commentary
Send your comment, doubt, correction, or feedback to admin.
Similar Questions
Explore conceptually related problems
Physics
For a solid rod, the Young's modulus of elasticity is and density is . The velocity of lo…
T, is the time period of simple pendulum on the earth's surface. Its time period becomes when take…
Two long straight wires and carrying equal current each were kept parallel to each other at dis…
A ball is projected with kinetic energy , at an angle of to the horizontal. The kinetic energy of…
Three masses are placed on the -axis, mass of at origin, at and at . The distance of the cent…
A balloon contains of helium at and 4 atmospheric pressure. The volume of helium at temperature …