Published by:
CGP EDU Academic Team
Published on: September 13, 2026
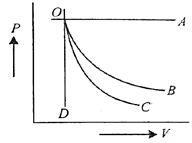
A graph of pressure versus volume for an ideal gas for different processes is as shown. In the graph curve  represents
Text Solution
Verified by ExpertsThe correct answer is:
D
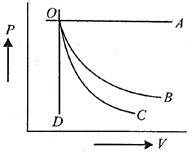
In the graph,
(i) curve  represents isobaric process (pressure is constant)
The slope of adiabatic process is more steeper than the isothermal process. Hence,
(ii) curve  represents isothermal process
(iii) curve  represents adiabatic process (steeper than
  )
)
(iv) curve  represents isochoric process (volume is constant).
Prepare Smarter with CGP Edu
Get practice questions, solutions, and test series in one place.
Write a Review
Share your experience with this question and solution.
Commentary
Send your comment, doubt, correction, or feedback to admin.
Similar Questions
Explore conceptually related problems
The freezer in a refrigerator is located at the top section so that
A Carnot engine takes heat from a reservoir at and rejects heat to a sink at . Its efficiency wil…
of heat is required to raise the temperature of 2 moles of an ideal gas at constant pressure from …
A Carnot's engine operates with source at and sink at . If the source supplies of heat energy, t…
An ideal gas is taken via path as shown in figure. The net workdone in the whole cycle is
In which of the processes, does the internal energy of the system remain constant?