Published by:
CGP EDU Academic Team
Published on: September 13, 2026
The voltage V and current I graphs for a conductor at two different temperatures  and
and  are shown in the figure. The relation between
  and
and  is
is
A

B

C

D

Text Solution
Verified by ExpertsThe correct answer is:
A
The slope of  graph gives the resistance of a conductor at a given temperature.
From the graph, it follows that resistance of a conductor at temperature  is greater than at temperature
  . As the resistance of a conductor is more at higher
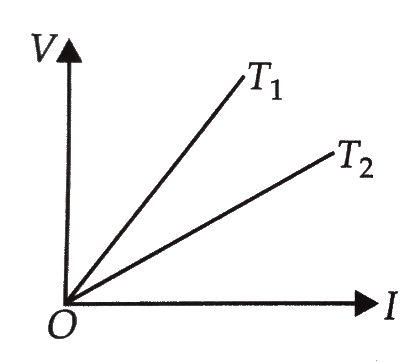
temperature and less at lower temperature, hence  .
.
Prepare Smarter with CGP Edu
Get practice questions, solutions, and test series in one place.
Write a Review
Share your experience with this question and solution.
Commentary
Send your comment, doubt, correction, or feedback to admin.
Similar Questions
Explore conceptually related problems
A battery of emf and internal resistance is connected to a resistor. The current in the circuit i…
The electron drift speed is small and the charge of the electron is also small but still, we obtain…
In the circuit shown, the value of I in ampere is
A lamp is to be operated on a 120 V D.C. line. For proper glow, a resistor of ohm should be connec…
A battery consists of a variable number (n) of identical cells, each having an internal resistance …
A current of enters one corner of an equilateral triangle having 3 wires of resistances each an…