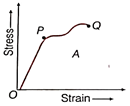
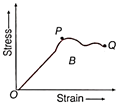
The stress-strain graphs for materials A and B are shown in figs. (i) and (ii) (given,  ).
).
(i) (ii)
The graphs are drawn to the same scale.
Which of the two is the stronger material?
Text Solution
Verified by ExpertsThe correct answer is:
B
From the given figure, we can say that, the slope of the linear portion of the stress-strain curve
is greater for material B. Hence, Young's modulus of B is greater than that of material A. Material B can withstand more load without breaking.
So, it is stronger than material A and its ultimate stress is higher.
Prepare Smarter with CGP Edu
Get practice questions, solutions, and test series in one place.
Write a Review
Share your experience with this question and solution.
Commentary
Send your comment, doubt, correction, or feedback to admin.
Similar Questions
Explore conceptually related problems
Stress-strain curve for four metals are shown in figure. The maximum Young's modulus of elasticity …
Two stress-strain graphs A and B are drawn by a student (as shown below) but he forgets to specify …
In plotting stress versus strain curves for two materials P and Q, a student by mistake puts strain…
Diagram shows the stress-strain graph for a metal wire. In the graph, the region in which Hooke's l…
The graph shows the behaviour of a length of wire in the region for which the substance obeys Hooke…
Two wires of copper having the length in the ratio and their radii ratio as are stretched by the …