Published by:
CGP EDU Academic Team
Published on: September 12, 2026
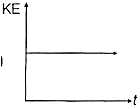
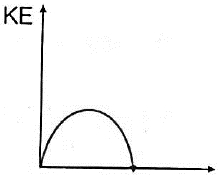
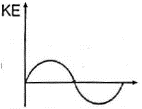
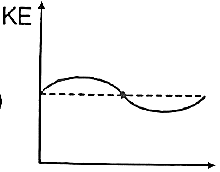
Which of the following diagrams most closely shows the variation in kinetic energy of the earth as it moves once around the sun in its elliptical orbit?
A
B
C
D
Text Solution
Verified by ExpertsThe correct answer is:
D
When the earth is closest to the sun, speed of the earth is maximum, hence kinetic energy is maximum.
When the earth is farthest from the sun, speed is minimum, hence kinetic energy is minimum but it will never be zero and negative.
This variation is correctly represented by option .
Prepare Smarter with CGP Edu
Get practice questions, solutions, and test series in one place.
Write a Review
Share your experience with this question and solution.
Commentary
Send your comment, doubt, correction, or feedback to admin.
Similar Questions
Explore conceptually related problems
A particle is moving on a circle of radius 5 m. A constant force of magnitude 10 N acts on the part…
The graph shows the variation of acceleration with position of a 3 kg particle, initially at rest, …
A body of mass 6 kg, under the action of force, suffers displacement, given by , where t is time. …
In the track shown in the figure, section is a quadrant of a circle of 1 m radius. A block is rele…
The ratio of work done by the internal forces of a car to change its speed from to, is (Assume th…
A block, attached to a spring is kept on a smooth surface, and is pulled by a constant horizontal f…