Published by:
CGP EDU Academic Team
Published on: September 12, 2026
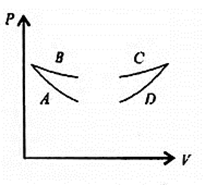
Four curves  , and
, and  are drawn in the figure for a given amount of gas. The curves which represent adiabatic and isothermal changes are
A
 and
and  , respectively
 B
 and
and  , respectively
 C
 and
and  , respectively
 D
 and
and  , respectively
Text Solution
Verified by ExpertsThe correct answer is:
C
Isothermal, 
Adiabatic, 
Also, slope of adiabatic is more as compared to isothermal.
Prepare Smarter with CGP Edu
Get practice questions, solutions, and test series in one place.
Write a Review
Share your experience with this question and solution.
Commentary
Send your comment, doubt, correction, or feedback to admin.
Similar Questions
Explore conceptually related problems
One mole of an ideal gas undergoes a process whose molar heat capacity is and in which work done b…
In a thermodynamic process, pressure of a fixed mass of a gas is changed such that the gas releases…
A system is taken along the paths and , as shown. If the amounts of heat given in these processes…
In the cyclic process shown on the diagram, the magnitude of the work done is
A fixed mass of ideal gas undergoes changes of pressure and volume starting at , as shown in the F…
Ideal gas is taken through process, shown in the figure. Choose the correct statement.