Published by:
CGP EDU Academic Team
Published on: September 12, 2026
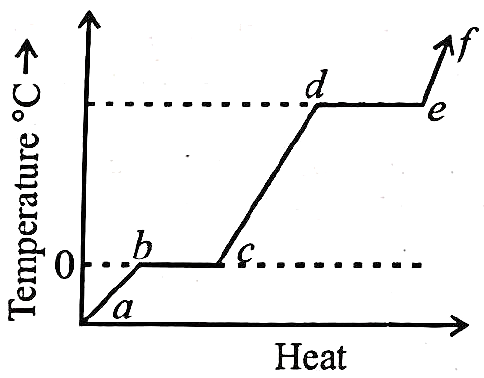
The following figure represents the temperature versus heat plot for a given amount of a substance when heat energy is supplied to it at a fixed rate and at a constant pressure. Which part of the above plot represent a phase change
A
 to
to  and
and  to
to 
B
 to
to  and
and  to
to 
C
 to
to  and
and  to
to 
D
 to
to  and
and  to
to 
Text Solution
Verified by ExpertsThe correct answer is:
D
Phase change is a constant process where heat is supplied but there is no rise in temperature.
Prepare Smarter with CGP Edu
Get practice questions, solutions, and test series in one place.
Write a Review
Share your experience with this question and solution.
Commentary
Send your comment, doubt, correction, or feedback to admin.
Similar Questions
Explore conceptually related problems
The variation of temperature ( ) of material as heat is given to it at a constant rate is shown in…
Figure shows the temperature variation when heat is added continuously to a specimen of ice (10 g) …
Heat is supplied to a certain amount of ice at a constant rate for 9 minute. For the first one minu…
If we mix 100 g ice at and 100 g steam at , then choose the incorrect option
Given: .
Two solid objects of the same mass are supplied with heat at the same rate . The temperature of th…
Two substances and of equal masses are heated at uniform rate of under similar conditions. A gr…