Published by:
CGP EDU Academic Team
Published on: September 12, 2026
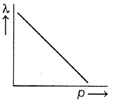
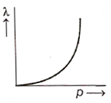
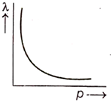
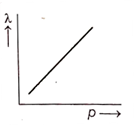
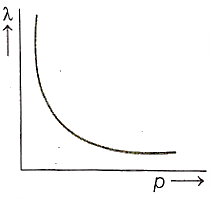
The graph which shows the variation of the de-Broglie wavelength (λ) of a particle and its associated momentum (p) is [NEET 2022]
A
B
C
D
Text Solution
Verified by ExpertsThe correct answer is:
C
de-Broglie wavelength (λ) of a moving particle is given as
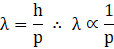
Hence, the graph showing the variation of de-Broglie wavelength (λ) of a moving particle with its momentum (p) is shown below.
Prepare Smarter with CGP Edu
Get practice questions, solutions, and test series in one place.
Write a Review
Share your experience with this question and solution.
Commentary
Send your comment, doubt, correction, or feedback to admin.
Similar Questions
Explore conceptually related problems
An electron is accelerated through a potential difference of 10,000 V Its de Broglie wavelength is,…
The work function of a photosensitive material is The longest wavelength of light that can cause p…
An electron of mass m with an initial velocity enters an electric field constant at If is its …
When the light of frequency (where is threshold frequency), is incident on a metal plate, the max…
The de‐Broglie wavelength of a neutron in thermal equilibrium with heavy water at a temperature ke…
Electrons of mass with de‐Broglie wavelength fall on the target in an ‐ray tube. The cutoff wave…