Which of the following is the graph between the height ( h ) of a projectile and time ( t ), when it is projected from the ground
A
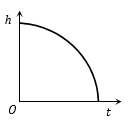
B
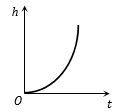
C
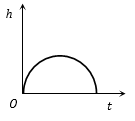
D
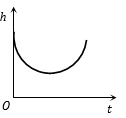
Text Solution
Verified by ExpertsThe correct answer is:
C
No detailed text explanation provided yet.
Prepare Smarter with CGP Edu
Get practice questions, solutions, and test series in one place.
Write a Review
Share your experience with this question and solution.
Commentary
Send your comment, doubt, correction, or feedback to admin.
Similar Questions
Explore conceptually related problems
A body of mass hangs at one end of a string of length l , the other end of which is fixed. It is g…
The tension in the string revolving in a vertical circle with a mass m at the end which is at the l…
A stone of mass m is tied to a string and is moved in a vertical circle of radius r making n revolu…
A tube of length is filled completely with an incompressible liquid of mass and closed at both th…
The kinetic energy of a particle moving along a circle of radius depends on the distance covered …
A car is moving in a circular horizontal track of radius 10 m with a constant speed of 10 m/sec . A…