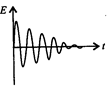
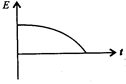
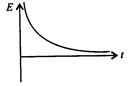
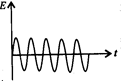
Which of the diagrams shown in figure represents variation of total mechanical energy of a pendulum oscillation in air as function of time?
A
B
C
D
Text Solution
Verified by ExpertsThe correct answer is:
C
: When a pendulum is oscillating in air, its total mechanical energy decreases exponentially with time. Hence, option represents correct diagram.
Prepare Smarter with CGP Edu
Get practice questions, solutions, and test series in one place.
Write a Review
Share your experience with this question and solution.
Commentary
Send your comment, doubt, correction, or feedback to admin.
Similar Questions
Explore conceptually related problems
A neutron travelling with a velocity v and K.E. E collides perfectly elastically head on with the n…
A ball bounces to 80% of its original height. What fraction of its mechanical energy is lost in eac…
The negative of the work done by the conservative internal forces on a system equals to the change …
A particle of mass m is moving in a horizontal circle of radius r, under a centripetal force equal …
The bob of a pendulum is released from a horizontal position If the length of pendulum is 2 m, what…
A ball of mass m is dropped from a cliff of height H. The ratio of its kinetic energy to the potent…