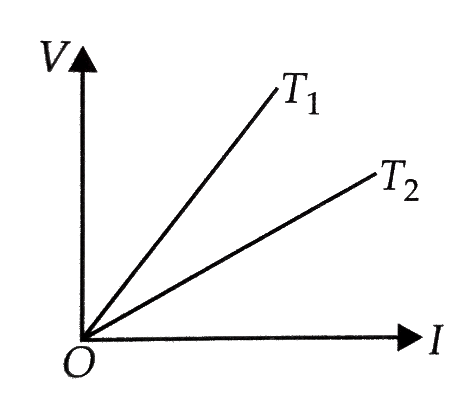
The voltage  and current
  graphs for a conductor at two different temperatures
  and
and  are shown in the figure. The relation between
  and
and  is
is
A

B

C

D

Text Solution
Verified by ExpertsThe correct answer is:
A
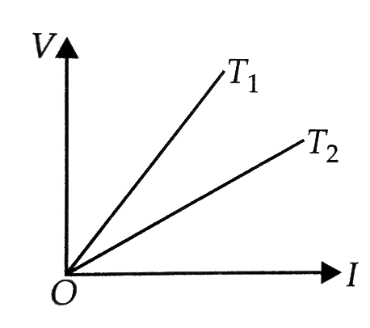
The slope of  graph gives the resistance of a conductor at a given temperature.
From the graph,  is greater than at temperature
  . As the resistance of a conductor is more at higher temperature and less at lower temperature, hence
  .
.
Prepare Smarter with CGP Edu
Get practice questions, solutions, and test series in one place.
Write a Review
Share your experience with this question and solution.
Commentary
Send your comment, doubt, correction, or feedback to admin.
Similar Questions
Explore conceptually related problems
In an electrical cable there is a single wire of radius 9 mm of copper. Its resistance is 5 Ω Ω . T…
Two uniform wires A and B are of the same metal and have equal masses. The radius of wire A is twic…
Twelve wires of equal length and same cross-section are connected in the form of a cube. If the res…
The resistance of a wire is per meter. It is bend in the form of a circle of diameter 2m. A wire o…
When the key K is pressed at time t = 0, which of the following statements about the current I in t…
A torch bulb rated as 4.5 W, 1.5 V is connected as shown in the figure. The e.m.f. of the cell need…