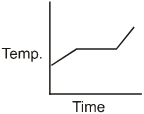
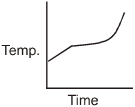
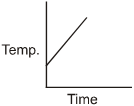
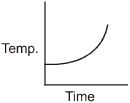
Liquid oxygen at 50K is heated to 300 K at constant pressure of 1 atm. The rate of heating is constant. Which one of the following graphs represents the variation of temperature with time
A
B
C
D
Text Solution
Verified by ExpertsThe correct answer is:
A
Initially liquid oxygen will gain the temp. up to its boiling temperature then it change its state
to gas. After this again its temperature will increase, so corresponding graph will be option
Prepare Smarter with CGP Edu
Get practice questions, solutions, and test series in one place.
Write a Review
Share your experience with this question and solution.
Commentary
Send your comment, doubt, correction, or feedback to admin.
Similar Questions
Explore conceptually related problems
Steam at 100 0 C is passed into 20g of water at 10 0 C When water acquires a temperature of 80 0 C,…
The value of coefficient of volume expansion of glycerin is 5 × 10 –4 K –1 . The fractional change …
a piece of ice falls from a height h so that it melts completely. Only one-quarter of the heat prod…
A metal rod of Young’s modulus Y and coefficient of thermal expansion α is held at its two ends suc…
An aluminium sphere of 20 cm diameter is heated from 0ºC to 100ºC. Its volume changes by (given tha…
A wooden wheel of radius R is made of two semicircular parts (see figure). The two parts are held t…