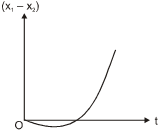
A body is at rest at x = 0. At t = 0, it starts moving in the positive x-direction with a constant acceleration. At the same instant another body passes through x = 0 moving in the positive x-direction with a constant speed. The position of the first body is given by x 1 (t) after time ‘t’ and that of second body by x 2 (t) after the same time interval. Which of the following graphs correctly describes (x 1 – x 2 ) as a function of time ‘t’ ?
A
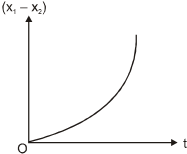
B
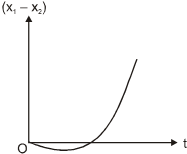
C
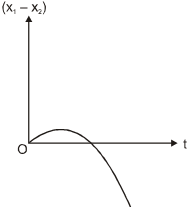
D
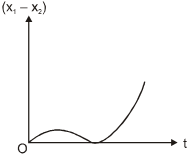
Text Solution
Verified by ExpertsThe correct answer is:
B
Here x 2 = vt and = 
x 1 – x 2 = – 
So, the graph would be like
Prepare Smarter with CGP Edu
Get practice questions, solutions, and test series in one place.
Write a Review
Share your experience with this question and solution.
Commentary
Send your comment, doubt, correction, or feedback to admin.
Similar Questions
Explore conceptually related problems
Two trains, each 50 m long are travelling in opposite direction with velocity 10 m/s and 15 m/s . T…
A 120 m long train is moving in a direction with speed 20 m/s . A train B moving with 30 m / s in t…
A 210 meter long train is moving due North at a of 25m/s. A small bird is flying due South a little…
A police jeep is chasing with, velocity of 45 km / h a thief in another jeep moving with velocity 1…
A boat is sent across a river with a velocity of 8 km/hr. If the resultant velocity of boat is 10 k…
A train of 150 meter length is going towards north direction at a speed of . A parrot flies at the…