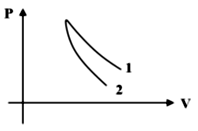
P - V plots for two gases during adiabatic processes are shown in the figure. Plots 1 and 2 should correspond respectively to
Text Solution
Verified by ExpertsThe correct answer is:
B
O 2 and He
In adiabatic process, slope of P - V graph is given as, 
For a given P - V graph, slope 
From the given graph,
(slope) 2 > (slope) 1

Therefore, plot 1 should correspond to O 2 (  = 1.4) and plot 2 should correspond to He (
  = 1.67).
Prepare Smarter with CGP Edu
Get practice questions, solutions, and test series in one place.
Write a Review
Share your experience with this question and solution.
Commentary
Send your comment, doubt, correction, or feedback to admin.
Similar Questions
Explore conceptually related problems
If AB is an isothermal, BC is an isochoric and AC is an adiabatic, which of the graphs correctly re…
Some ideal monoatomic gas A in an enclosure has a pressure P and the temperature T. Another ideal m…
The temperature of n moles of an ideal gas is increased from T to 4T through a process for which pr…
An ideal gas expands isothermally from volume V 1 to V 1 and then it is adiabatically compressed ba…
A monoatomic gas of molar mass mo is filled into an insulated container which is moving along a hor…
Three rods made from the same material and having the same cross-sectional area, form the sides of …