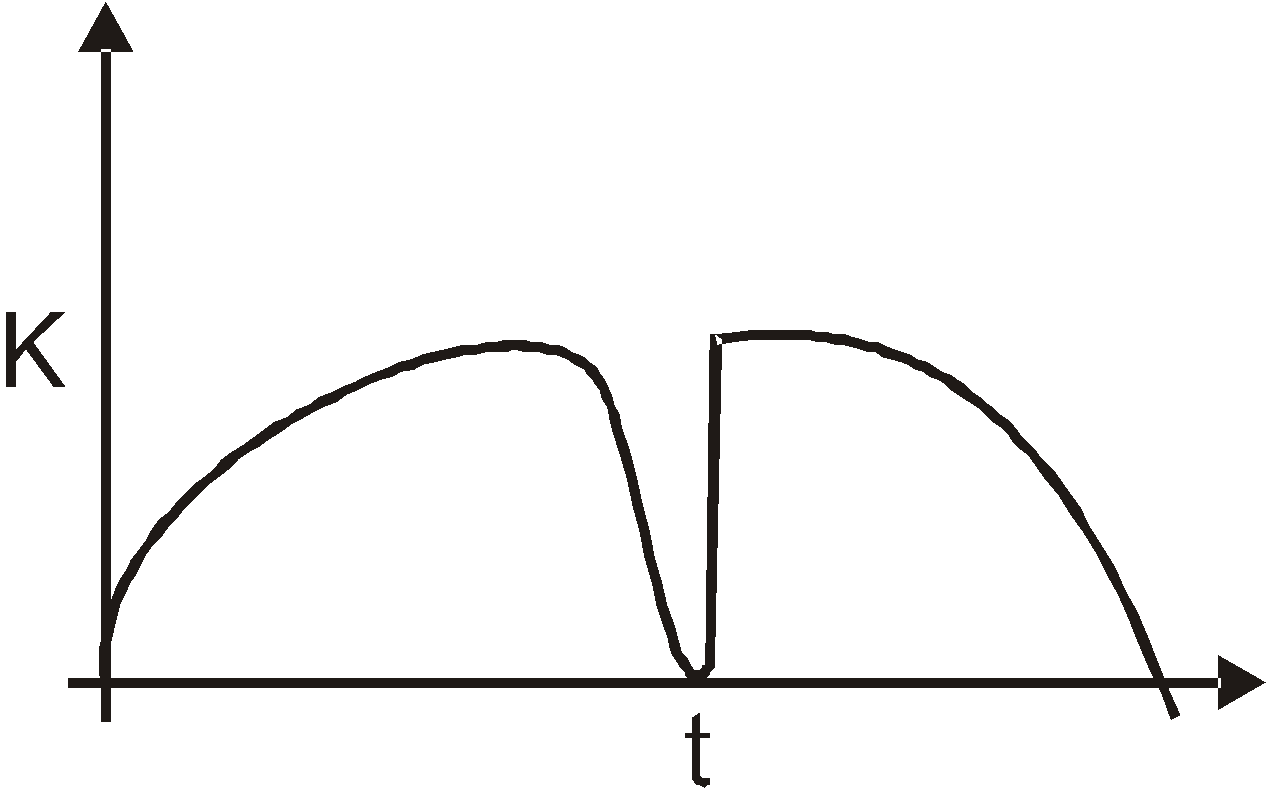
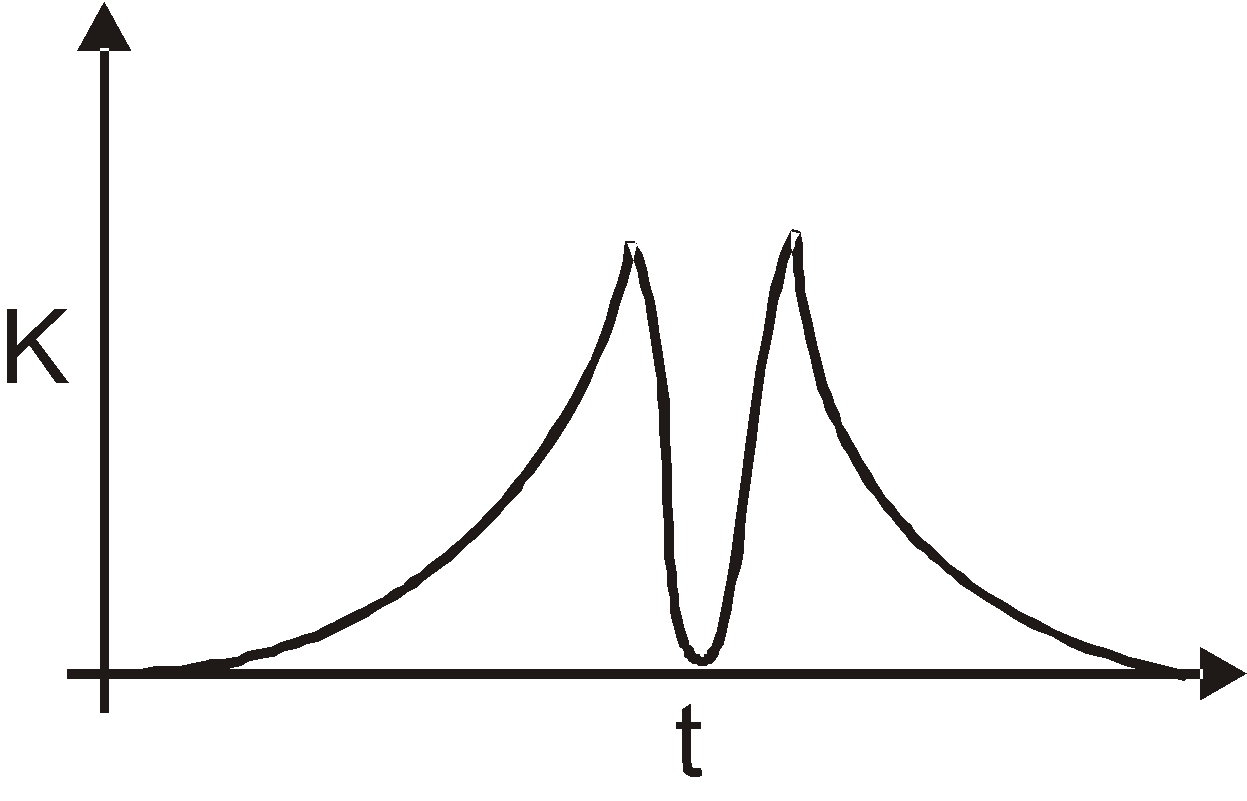
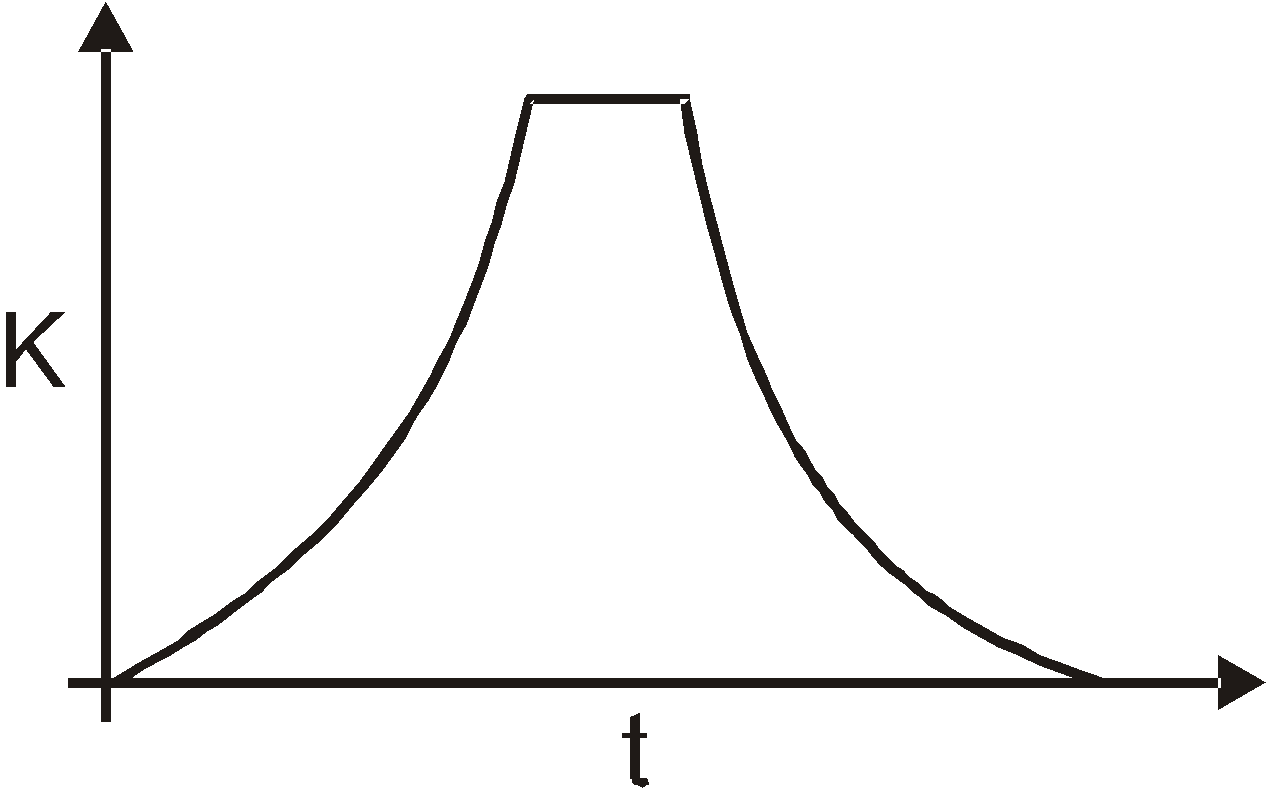
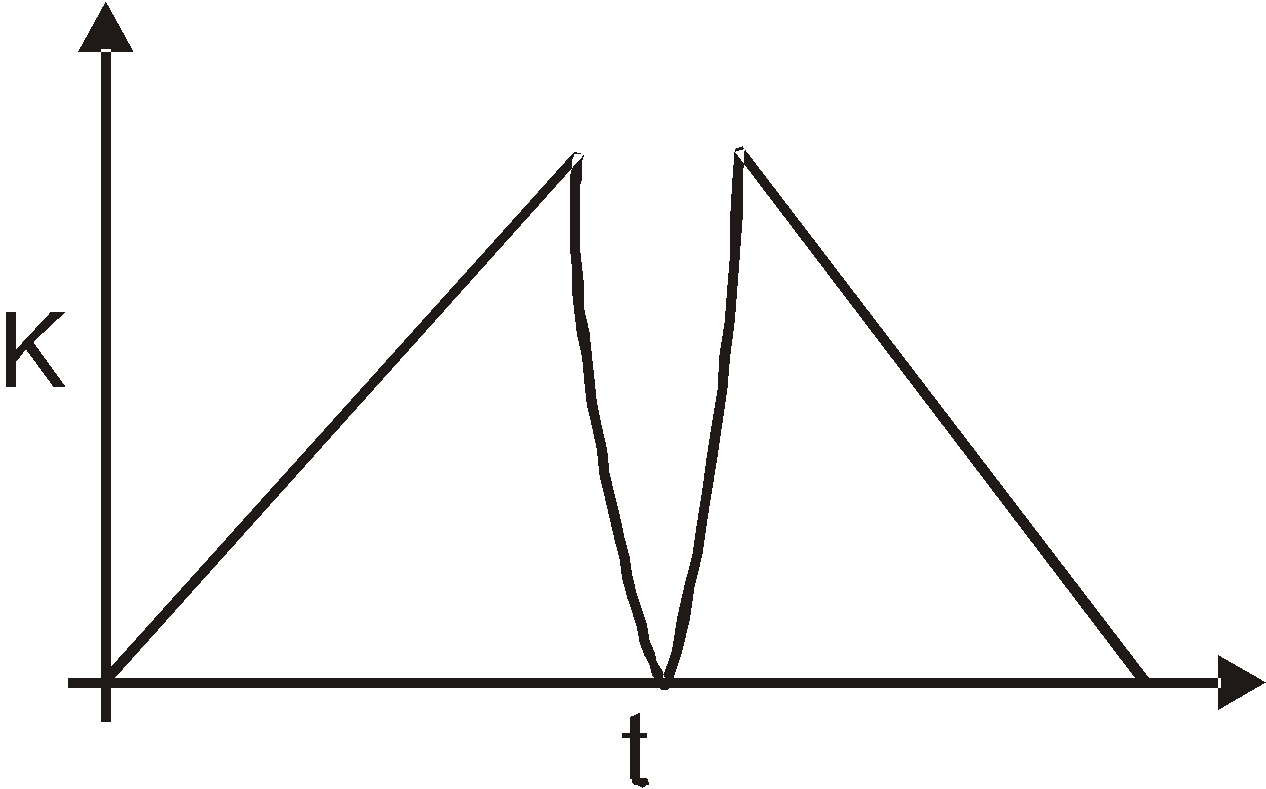
A tennis ball is dropped on a horizontal smooth surface. It bounces back to its original position after hitting the surface. The force on the ball during the collision is proportional to the length of compression of the ball. Which one of the following sketches describes the variation of its kinetic energy K with time t most appropriately? The figures are only illustrative and not to the scale.
Text Solution
Verified by ExpertsB
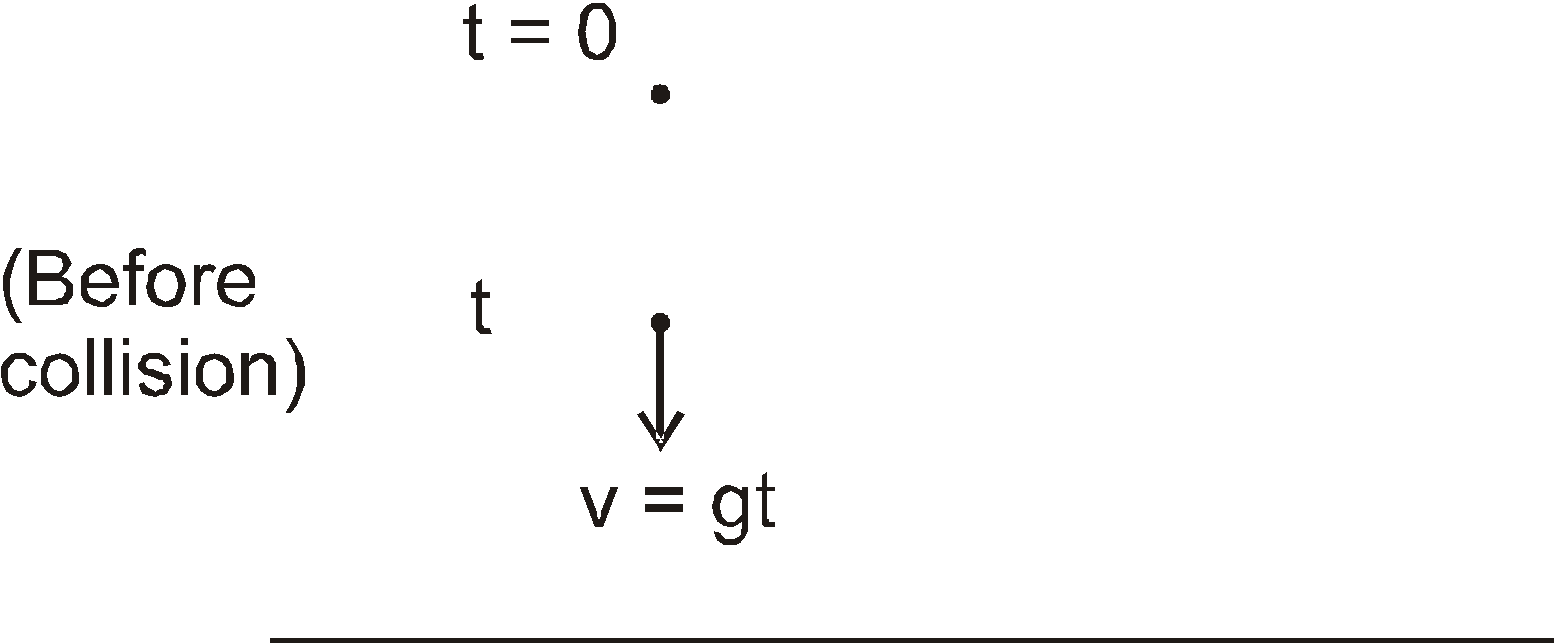
K = 
 : parabolic graph
then during collision kinetic energy first decreases to elastic potential energy and then increases.
Most appropriate graph is B
Prepare Smarter with CGP Edu
Get practice questions, solutions, and test series in one place.
Write a Review
Share your experience with this question and solution.
Commentary
Send your comment, doubt, correction, or feedback to admin.
Similar Questions
Explore conceptually related problems