Published by:
CGP EDU Academic Team
Published on: September 12, 2026
A car changes its velocity linearly from
to
in 5 s. Plot
-
graph and write
velocity as a function.
Text Solution
Verified by ExpertsThe correct answer is:
A
Step 1: Understanding the problem
The car's initial velocity is 10 m/s and final velocity is 20 m/s. It changes its velocity in 5 seconds.
Step 2: Calculate acceleration
The car accelerates uniformly, so we use the formula:
$$ a = \frac{v_f - v_i}{t} $$
Where:
- $v_f$ = final velocity = 20 m/s
- $v_i$ = initial velocity = 10 m/s
- $t$ = time = 5 s
Calculating acceleration:
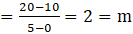
$$ a = \frac{20 \text{ m/s} - 10 \text{ m/s}}{5 \text{ s}} = \frac{10 \text{ m/s}}{5 \text{ s}} = 2 \text{ m/s}^2 $$
Step 3: Writing velocity as a function of time
The equation of motion for uniform acceleration is given by:
$$ v(t) = v_i + at $$
Substituting the values:
$$ v(t) = 10 \text{ m/s} + (2 \text{ m/s}^2)(t) $$
Step 4: Final Equation
So, the velocity as a function of time can be expressed as:
$$ v(t) = 10 + 2t $$
Step 5: Graphing the function
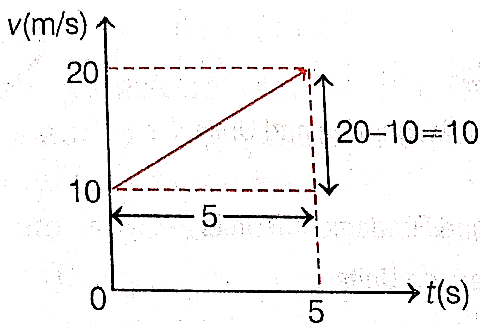
The graph of $v(t)$ versus $t$ will be a straight line starting at (0, 10) and going through (5, 20). This indicates that the velocity increases linearly over time from 10 m/s to 20 m/s in 5 seconds.
The car's initial velocity is 10 m/s and final velocity is 20 m/s. It changes its velocity in 5 seconds.
Step 2: Calculate acceleration
The car accelerates uniformly, so we use the formula:
$$ a = \frac{v_f - v_i}{t} $$
Where:
- $v_f$ = final velocity = 20 m/s
- $v_i$ = initial velocity = 10 m/s
- $t$ = time = 5 s
Calculating acceleration:
$$ a = \frac{20 \text{ m/s} - 10 \text{ m/s}}{5 \text{ s}} = \frac{10 \text{ m/s}}{5 \text{ s}} = 2 \text{ m/s}^2 $$
Step 3: Writing velocity as a function of time
The equation of motion for uniform acceleration is given by:
$$ v(t) = v_i + at $$
Substituting the values:
$$ v(t) = 10 \text{ m/s} + (2 \text{ m/s}^2)(t) $$
Step 4: Final Equation
So, the velocity as a function of time can be expressed as:
$$ v(t) = 10 + 2t $$
Step 5: Graphing the function
The graph of $v(t)$ versus $t$ will be a straight line starting at (0, 10) and going through (5, 20). This indicates that the velocity increases linearly over time from 10 m/s to 20 m/s in 5 seconds.
Prepare Smarter with CGP Edu
Get practice questions, solutions, and test series in one place.
Write a Review
Share your experience with this question and solution.
Commentary
Send your comment, doubt, correction, or feedback to admin.
Similar Questions
Explore conceptually related problems