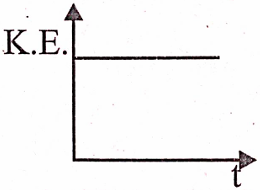
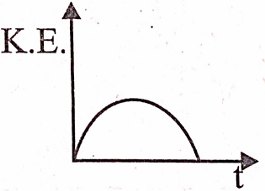
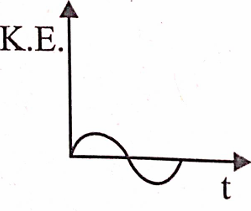
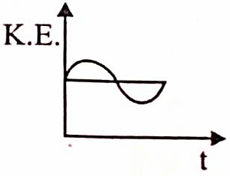
Which of the diagrams shown in figure most closely shows the variation in kinetic energy of the earth as it moves once around the sun in its elliptical orbit?
A
B
C
D
Text Solution
Verified by ExpertsThe correct answer is:
D
When the Earth is closest to the Sun, speed of the Earth is maximum, hence, KE is maximum.
When the Earth is farthest from the Sun speed is minimum hence, KE is minimum but never zero and negative.
This variation is correctly represented by option .
Prepare Smarter with CGP Edu
Get practice questions, solutions, and test series in one place.
Write a Review
Share your experience with this question and solution.
Commentary
Send your comment, doubt, correction, or feedback to admin.
Similar Questions
Explore conceptually related problems
The Earth is an approximate sphere. If the interior contained matter which is not of the same densi…
As observed from the Earth, the Sun appears to move in an approximate circular orbit. For the motio…
Different points in the Earth are at slightly different distances from the Sun and hence experience…
Satellites orbiting the Earth have finite life and sometimes debris of satellites fall to the Earth…
Both the Earth and the Moon are subject to the gravitational force of the Sun. As observed from the…
In our solar system, the inter-planetary region has chunks of matter (much smaller in size compared…