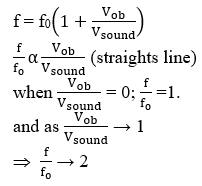
A curve is plotted to represent the dependence of the ratio of the received frequency f to the frequency f 0 emitted by the source on the ratio of the speed of observer V ob to the speed of sound V sound in a situation in which an observer is moving towards a stationary sound source. The curve is best represented by:
A
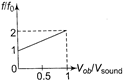
B
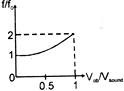
C
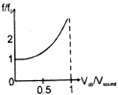
D
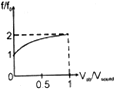
Text Solution
Verified by ExpertsThe correct answer is:
A
Prepare Smarter with CGP Edu
Get practice questions, solutions, and test series in one place.
Write a Review
Share your experience with this question and solution.
Commentary
Send your comment, doubt, correction, or feedback to admin.
Similar Questions
Explore conceptually related problems
The ends of a stretched wire of length L are fixed at and In one experiment, the displacement of …
In a large room, a person receives direct sound waves from a source 120 meters away from him. He al…
A train has just complicated a U-curve in a track which is a semicircle. The engine is at the forwa…
In the experiment for the determination of the speed of sound in air using the resonance column met…
Two cars are moving on two perpendicular roads towards a crossing with uniform speeds of 72 km/hr a…
A source producing sound of frequency 170 Hz is approaching a stationary observer with a velocity 1…