Published by:
CGP EDU Academic Team
Published on: September 12, 2026
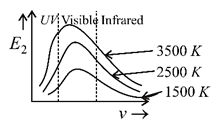
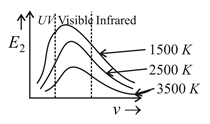
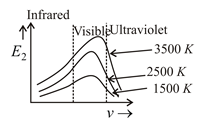
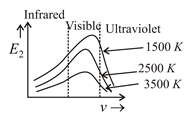
Following graphs show the variation in the intensity of heat radiations by the black body and frequency at a fixed temperature. Choose the correct option.
A
B
C
D
Text Solution
Verified by ExpertsThe correct answer is:
C
As the temperature of body increases, the frequency corresponding to maximum energy in radiation  increases. This is shown in the graph.
Prepare Smarter with CGP Edu
Get practice questions, solutions, and test series in one place.
Write a Review
Share your experience with this question and solution.
Commentary
Send your comment, doubt, correction, or feedback to admin.
Similar Questions
Explore conceptually related problems
A rod of 40 cm in length and temperature difference of $80^{\circ}C$ at its two ends. Another rod B…
In a steady state of thermal conduction, temperature of the ends A and B of a 20 cm long rod are a…
Four rods of silver, copper, brass and wood are of same shape. They are heated together after wrapp…
The two opposite faces of a cubical piece of iron (thermal conductivity = 0.2 CGS units) are at $10…
Wein's constant is $2892 \times 10^{-6}$ MKS unit and the value of $\lambda_{m}$ from moon is 14.46…
If at temperature $T_{1} = 1000 \mathrm{K},$ the wavelength is $1.4 \times 10^{-6} \mathrm{m},$ the…