Published by:
CGP EDU Academic Team
Published on: September 13, 2026
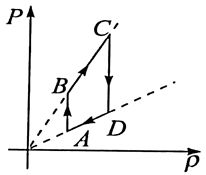
Pressure versus density graph of an ideal gas is shown in the figure. Choose the correct statement.
A
During the process  , work done by the gas is positive
, work done by the gas is positive B
During the process  , work done by the gas is negative
, work done by the gas is negative C
During the process  , internal energy of the gas is increasing
, internal energy of the gas is increasing D
During the process  , internal energy is constant.
, internal energy is constant.
Text Solution
Verified by ExpertsThe correct answer is:
D
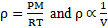
During  and
and  is constant. Therefore, work done is zero. During
  , i.e.,
  and hence,
  is constant.
Prepare Smarter with CGP Edu
Get practice questions, solutions, and test series in one place.
Write a Review
Share your experience with this question and solution.
Commentary
Send your comment, doubt, correction, or feedback to admin.
Similar Questions
Explore conceptually related problems
In a cyclic process shown in the figure, an ideal gas is adiabatically taken from and , the work …
An ideal monoatomic gas is taken through the thermodynamic states via paths shown in the figure. I…
5.6 L of helium gas at STP is adiabatically compressed to 0.7 L. Taking the initial temperature to …
Find the amount of work required to be done to increase the temperature of one mole of an ideal gas…
Heat energy absorbed by a system in going through a cyclic process, shown in the figure, is
An ideal gas expands isothermally from a volume to and then compressed to original volume adiaba…