Published by:
CGP EDU Academic Team
Published on: September 13, 2026
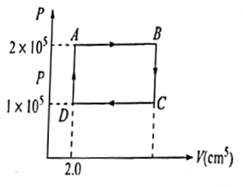
The  diagram of a gas undergoing a cyclic process (
  ) is shown in the graph where
  is in units of
  and
and  in
in  . Identify the incorrect statement.
A
0.4 J of work is done by the gas from  to
to 
to B
0.2 J of work is done on the gas from  to
to 
to C
Work is done by gas in going from  to
to  and on the gas from
  to
to 
to and on the gas from to D
Net work done by the gas in one cycle is 0.2 J
Text Solution
Verified by ExpertsThe correct answer is:
C
The area under  diagram
  work done
or 


Therefore, 0.2 J work done by the gas in going from  to
to  and on the gas from
  to
to  .
.
Prepare Smarter with CGP Edu
Get practice questions, solutions, and test series in one place.
Write a Review
Share your experience with this question and solution.
Commentary
Send your comment, doubt, correction, or feedback to admin.
Similar Questions
Explore conceptually related problems
In a cyclic process shown in the figure, an ideal gas is adiabatically taken from and , the work …
Pressure versus density graph of an ideal gas is shown in the figure. Choose the correct statement.
An ideal monoatomic gas is taken through the thermodynamic states via paths shown in the figure. I…
5.6 L of helium gas at STP is adiabatically compressed to 0.7 L. Taking the initial temperature to …
Find the amount of work required to be done to increase the temperature of one mole of an ideal gas…
Heat energy absorbed by a system in going through a cyclic process, shown in the figure, is