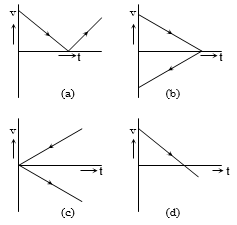
A ball is thrown vertically upwards. Which of the following graph/graphs represent velocity-time graph of the ball during its flight (air resistance is neglected)
Text Solution
Verified by ExpertsThe correct answer is:
D
In the positive region the velocity decreases linearly (during rise) and in the negative region
velocity increases linearly (during fall) and the direction is opposite to each other during
rise and fall, hence fall is shown in the negative region.
Prepare Smarter with CGP Edu
Get practice questions, solutions, and test series in one place.
Write a Review
Share your experience with this question and solution.
Commentary
Send your comment, doubt, correction, or feedback to admin.
Similar Questions
Explore conceptually related problems
A particle moving in a straight line covers half the distance with speed of 3 m/s . The other half …
A particle starts from rest. Its acceleration ( a ) versus time ( t ) is as shown in the figure. Th…
A car accelerates from rest at a constant rate for some time, after which it decelerates at a cons…
A stone dropped from a building of height and it reaches after seconds on earth. From the same bu…
A ball is projected upwards from a height above the surface of the earth with velocity . The time…
A particle is dropped vertically from rest from a height. The time taken by it to fall through succ…