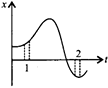
Figure shows the x-t plot of a particle in one-dimensional motion. Two different equal intervals of time are shown. Let  and
and  be average speed in time intervals 1 and 2 respectively. Than
A

B

C

D
Data is insufficient
Text Solution
Verified by ExpertsThe correct answer is:
A
The average speed in a small interval of time is equal to the slope of x-t graph during that interval. As slope of interval 1 > slope of interval 
Prepare Smarter with CGP Edu
Get practice questions, solutions, and test series in one place.
Write a Review
Share your experience with this question and solution.
Commentary
Send your comment, doubt, correction, or feedback to admin.
Similar Questions
Explore conceptually related problems
A particle moving in a straight line covers half the distance with speed of 3 m/s . The other half …
A particle starts from rest. Its acceleration ( a ) versus time ( t ) is as shown in the figure. Th…
A car accelerates from rest at a constant rate for some time, after which it decelerates at a cons…
A stone dropped from a building of height and it reaches after seconds on earth. From the same bu…
A ball is projected upwards from a height above the surface of the earth with velocity . The time…
A particle is dropped vertically from rest from a height. The time taken by it to fall through succ…