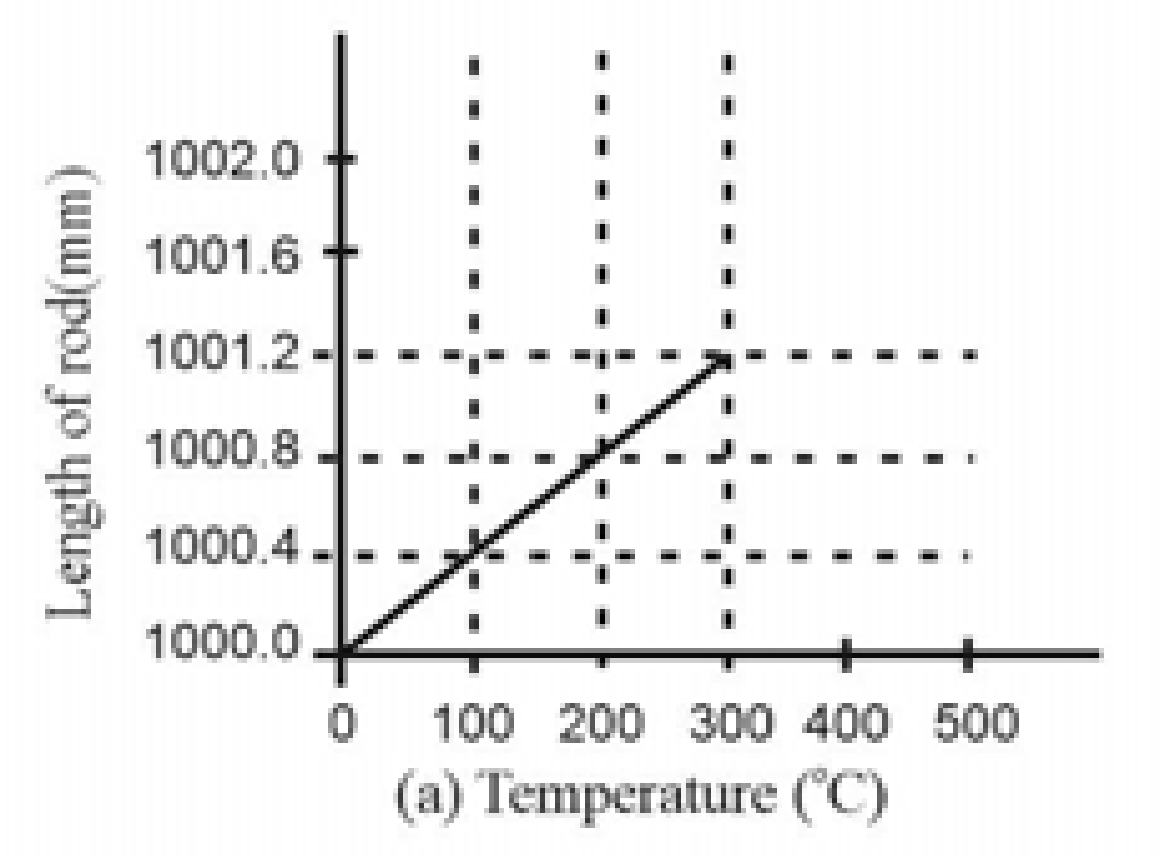
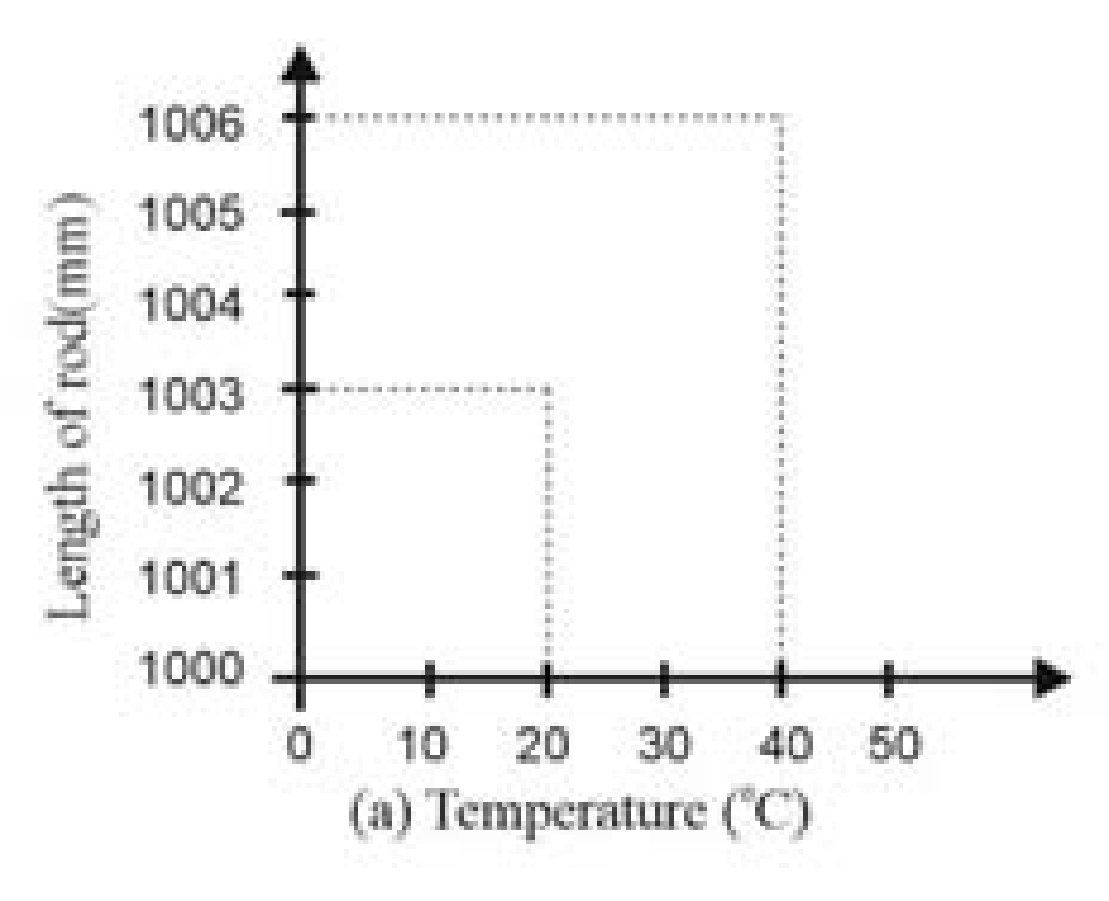
The graph of elongation of a rod of a substance A with temperature rise is shown in the first graph. A liquid B contained in a cylindrical vessel made out of substance A (graduated in millilitres) at 0 °C is heated gradually. The readings of the liquid level in the vessel corresponding to different temperatures are shown in the second graph. The real coefficient of volume expansion of the liquid is
Text Solution
Verified by ExpertsC
16.2 x 10 -5 0 C -1
From the graph ,
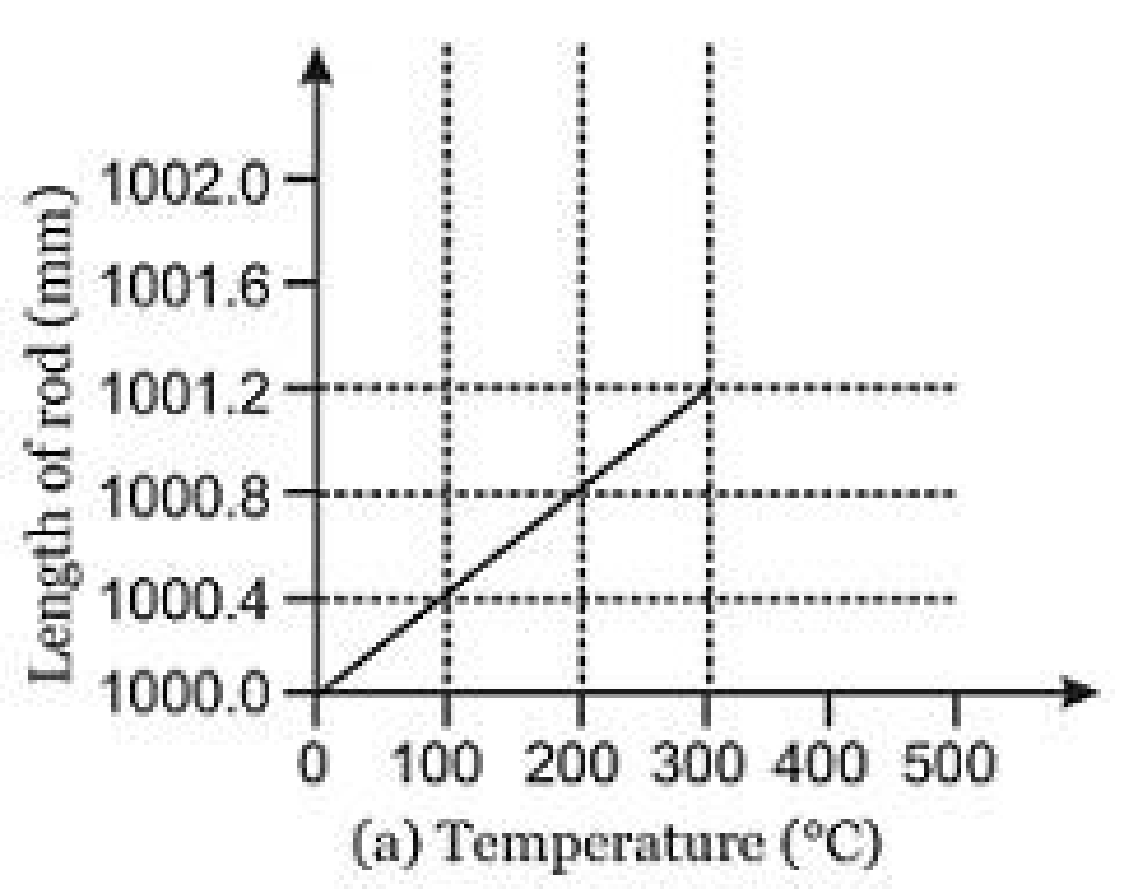
the slope of line is



But 


As shown in graph ,
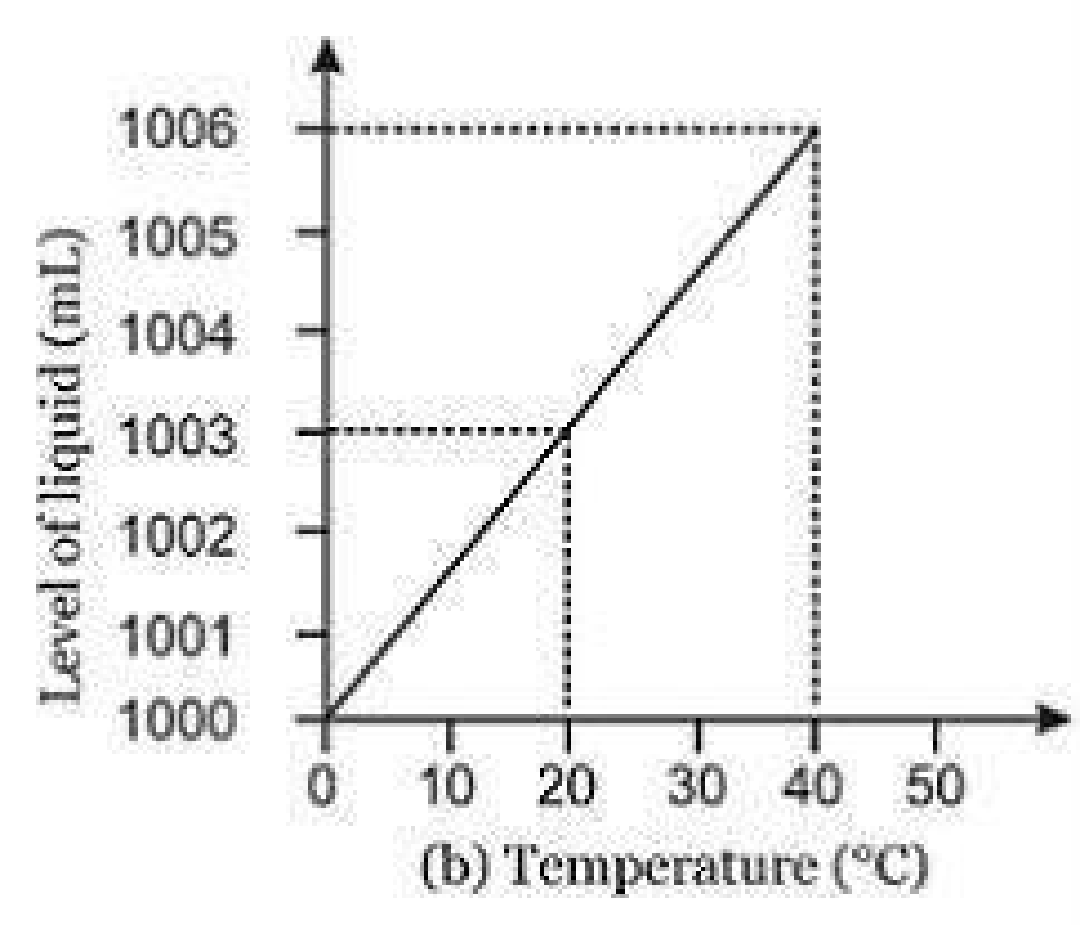
the slop of line is

But 

Since,  a =
a =  r -
r -  c
c

= (150 + 12) x 10 -6 °C -1
=16.2 x 10 -5 °C -1
Prepare Smarter with CGP Edu
Get practice questions, solutions, and test series in one place.
Write a Review
Share your experience with this question and solution.
Commentary
Send your comment, doubt, correction, or feedback to admin.
Similar Questions
Explore conceptually related problems