Published by:
CGP EDU Academic Team
Published on: September 13, 2026
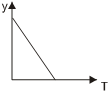
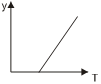
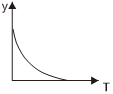
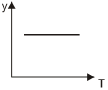
A hot liquid is kept in a big room. According to Newton's law of cooling rate of cooling of liquid (represented as y) is plotted against its temperature T. Which of the following curves may represent the plot?
A
B
C
D
Text Solution
Verified by ExpertsThe correct answer is:
B
Rate of cooling, y = (T – T 0 ) k (from Newton's law of cooling)
T 0 : surrounding temperature
k: +ve constant
⇒ graph is straight line with +ve slope
Prepare Smarter with CGP Edu
Get practice questions, solutions, and test series in one place.
Write a Review
Share your experience with this question and solution.
Commentary
Send your comment, doubt, correction, or feedback to admin.
Similar Questions
Explore conceptually related problems
Hot water cools from to in the first 10 minutes and to in the next 10 minutes. The temperature o…
A bucket full of hot water cools from 75^\circ C to $70^{0}C$ in time $T_1$ , from $70^\circ \mathr…
Consider two hot bodies $\mathbf{B}_1$ and $\mathbf{B}_{2}$ which have temperatures 100^\circ C and…
Newton's law of cooling is a special case of
Equal masses of two liquids are filled in two similar calorimeters. The rate of cooling will
In Newton's experiment of cooling, the water equivalent of two similar calorimeters is 10 gm each. …