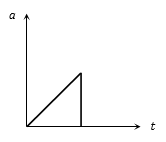
The acceleration-time graph of a body is shown below
 .
.
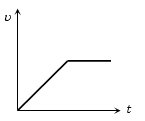
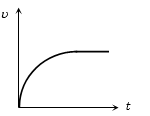
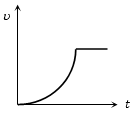
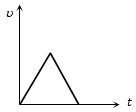
The most probable velocity-time graph of the body is
Text Solution
Verified by ExpertsC
From given 0 - t graph it is clear that acceleration is increasing at constant rate
 \(\frac{d\theta}{dt} - k\) (constant) ⇒ ⇒ \(\sigma = kt\) (by integration)
⇒ ⇒ \(\frac{dv}{dt} = kt\) ⇒ ⇒ \dot{c}_v = k t c_t
⇒ ⇒ \(\int d\tau = k \int r^2 \, dr\) ⇒ ⇒ \(v = \frac{kt^2}{2}\)
i.e. v is dependent on time parabolically and parabola is symmetric about v -axis.
and suddenly acceleration becomes zero. i.e . velocity becomes constant.
Hence is most probable graph.
Prepare Smarter with CGP Edu
Get practice questions, solutions, and test series in one place.
Write a Review
Share your experience with this question and solution.
Commentary
Send your comment, doubt, correction, or feedback to admin.
Similar Questions
Explore conceptually related problems