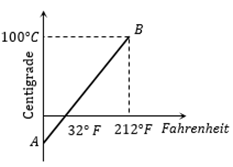
The graph AB shown in figure is a plot of temperature of a body in degree Celsius and degree Fahrenheit. Then
Text Solution
Verified by ExpertsThe correct answer is:
B
Relation between Celsius and Fahrenheit scale of temperature is  ⇒ ⇒ C =
Equating above equation with standard equation of line  we get slope of the line AB is
Prepare Smarter with CGP Edu
Get practice questions, solutions, and test series in one place.
Write a Review
Share your experience with this question and solution.
Commentary
Send your comment, doubt, correction, or feedback to admin.
Similar Questions
Explore conceptually related problems
A glass flask is filled up to a mark with 50 cc of mercury at 18ºC. If the flask and contents are h…
Solids expand on heating because
An iron tyre is to be fitted on to a wooden wheel 1m in diameter. The diameter of tyre is 6 mm smal…
A glass flask of volume one liter at 0°C is filled, level full of mercury at this temperature. The …
A steel scale measures the length of a copper wire as when both are at (the calibration temperatu…
Two metal strips that constitute a thermostat must necessarily differ in their