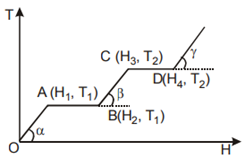
The graph shows the variation of temperature (T) of one kilogram of a material with the heat (H) supplied to it. At O, the substance is in the solid state. From the graph, we can conclude that
 is the melting point of the solid
 represents the latent heat of fusion of the substance
 represents the latent heat of vaporization of the liquid
Text Solution
Verified by ExpertsC
Since in the region AB temperature is constant therefore at this temperature phase of the
material changes from solid to liquid and (H 2 – H 1 ) heat will be absorb by the material. This heat is known as the heat of melting of the solid.
Similarly in the region CD temperature is constant therefore at this temperature phase of the material
changes from liquid to gas and (H 4 – H 3 ) heat will be absorb by the material. This heat as known as the
heat of vaporization of the liquid.
Prepare Smarter with CGP Edu
Get practice questions, solutions, and test series in one place.
Write a Review
Share your experience with this question and solution.
Commentary
Send your comment, doubt, correction, or feedback to admin.
Similar Questions
Explore conceptually related problems